Choose Graph tool
from More Objects
, drag to open the Graph Type dialog box. There are six types of graph: Bar Chart, f(x), Parametric
Functions, Pie Chart, Time Series and XY Plot. You can type in the data, or prepare the data in a text file using a text editor such as Notepad, or export a
data file from other application and drag in the file.
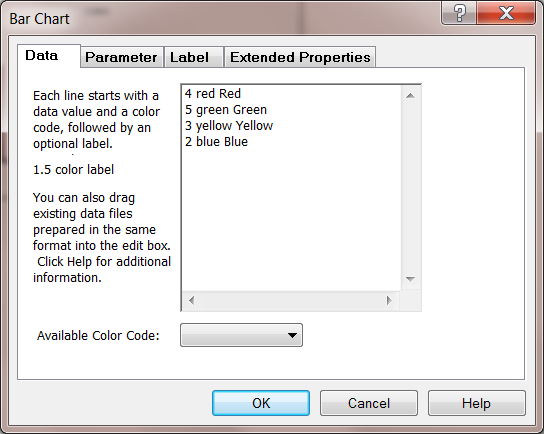
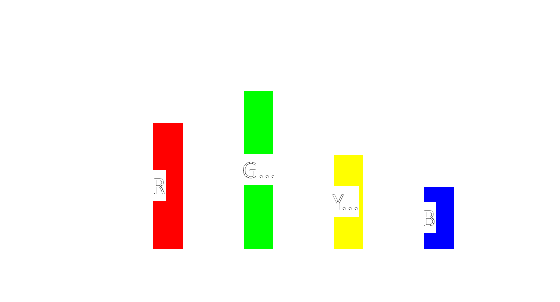
Bar Chart
Select Bar Chart to open Bar Chart dialog box. Enter data using data value, color, optional label and add Label.
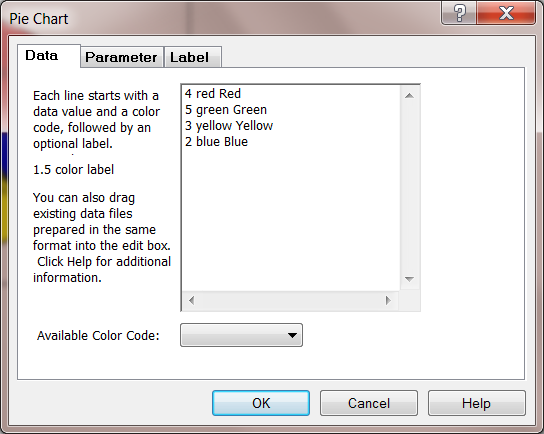
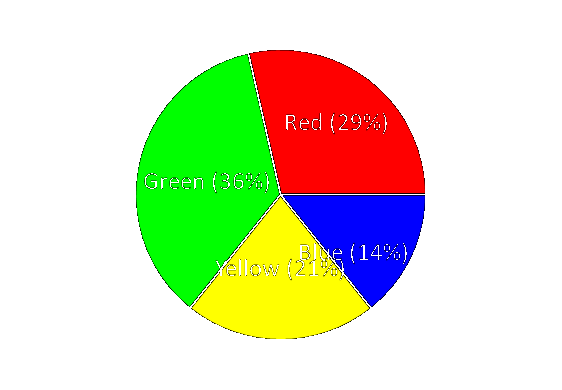
Pie Chart
Select Pie Chart dialog box. Enter data using data value, color, optional label.
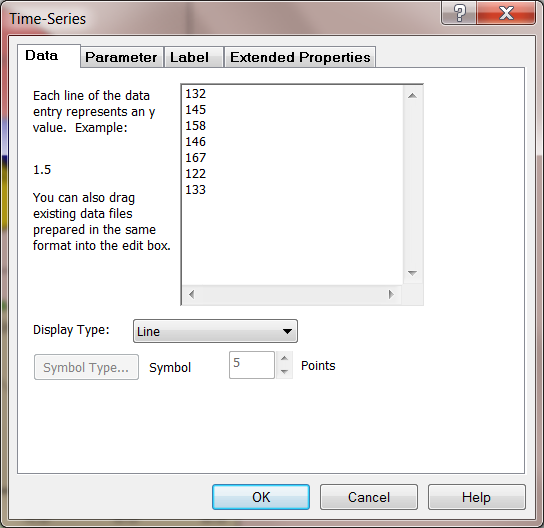
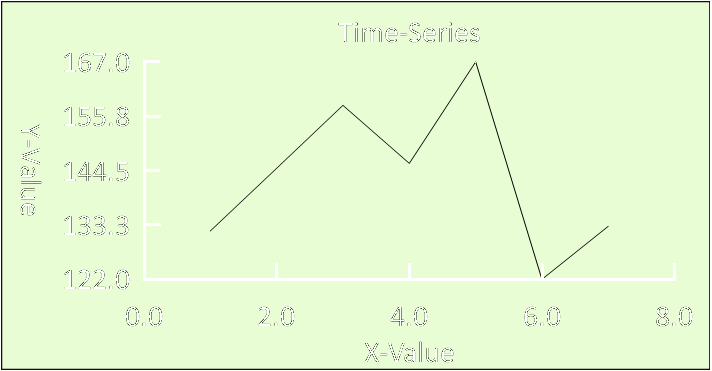
Time-Series
Select Time-Series to open Time-Series dialog box and type in data values.
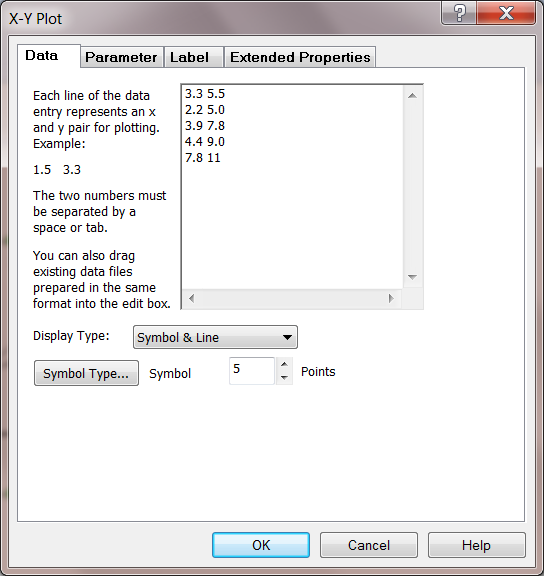
XY Plot
Select XY Plot to open X-Y Plot dialog box. Enter X and Y value.
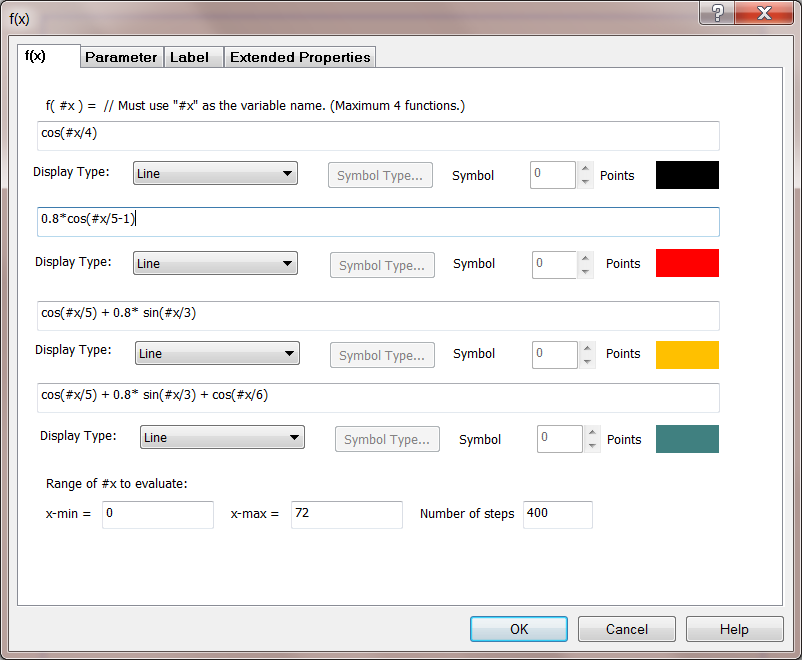
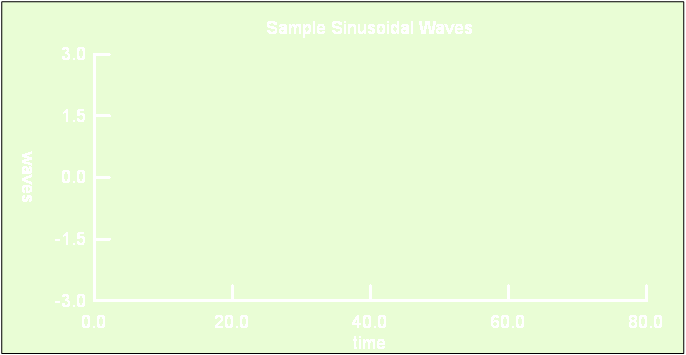
f(x)
Select f(x) to open f(x) dialog box. Use y=f(x) to draw data in xy plotting format.
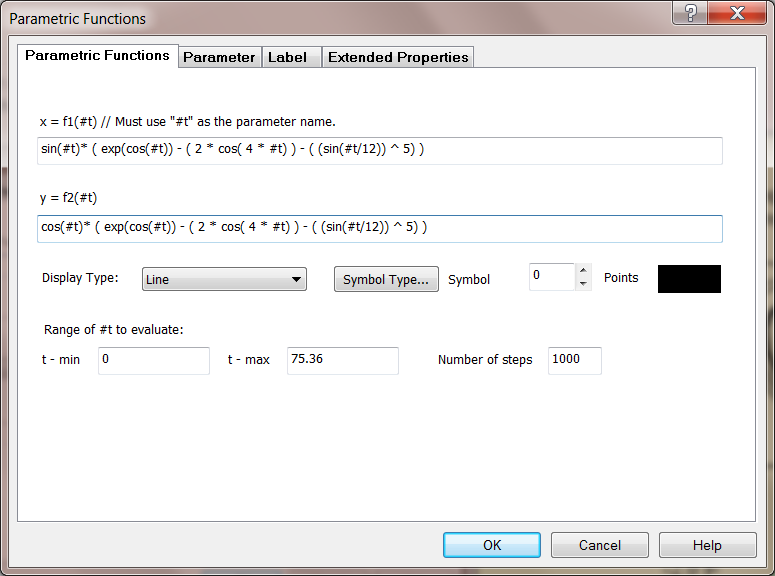
Parametric Functions
Select Parametric Functions to open Parametric Functions dialog box. Use parametric functions, x = f(t), y = g(t), to draw data in xy plotting format.


Home > Object Tool s > Working with Graphs
Working with Graphs
Creative Stars, Inc.
© 2015 Creative Stars